ILLINOIS MUSLIMS:
NEEDS, ASSETS, AND OPPORTUNITIES
JULY 28, 2022 | BY DALIA MOGAHED, DR. JOSEPH HOERETH, OJUS KHANOLKAR, AND UMAIR TARBHAI

INTRODUCTION
Illinois is home to a large and diverse community of Muslims, with the most recent available estimates placing the size at around 2,800 Muslims per 100,000 Illinoisans [5]. Given that there are around 12.5 million people in Illinois according to the 2020 census, that means at least 350,000 residents who self-identify as Muslims call Illinois home.
Despite being home to one of the larger populations of Muslims in America, there has never been an evidence-based portrait of this vibrant and diverse community statewide nor an assessment of their needs and opportunities. This report seeks to do just that.
Amidst the backdrop of a pandemic that disproportionately affects minority communities, systemic racial inequities, and an election year amidst widespread economic hardships, 2022 brings urgency to this initiative. Understanding the needs of diverse residents is critical for policy makers, social service agencies, businesses, employers, funders, journalists, and others.
Evidence-based decisions are vitally important. Quality research informs effective public, social, public health, and business policies. It enables smart activism, advocacy and community development programs and promotes fact-based versus fear-based decision-making and nuanced and accurate media reporting. Modeled after ISPU’s Bay Area Study, this research examines the needs, challenges, opportunities, and demographics of Illinois’ Muslim residents. The evidence-based portrait will help those working to strengthen our communities and build a more just and equitable Illinois, impacting philanthropic, social, civic, faith, public health, and business outcomes for decades. Researchers can use this report as a place to forge further research, and the general public can use this as an easy tool to understand an established and ever-growing population.
This research study is a collaboration between The Institute for Policy and Civic Engagement (IPCE) at the University of Illinois Chicago and the Institute for Social Policy and Understanding (ISPU), convened by the IL Muslim Civic Coalition (the Coalition) and its partners and allies across the region. This study is 100% funded by the generous contributions of Muslim community members and organizations.
This research builds on the important work of previous scholars. The last demographic survey on Muslims in Illinois was conducted in 1997 by Professor Ilyas Ba-Yunus. This predated the spread of online questionnaires but had a similar methodology to the present study, using snowball sampling within the city of Chicago and the surrounding suburbs and engaging Muslims who lived outside the Chicago metropolitan area by partnering with community centers, social service and civic organizations, and individual influencers across Illinois. Professor Ba-Yunus and the researchers acknowledged that his sample underrepresented African American Muslims. In addition, his team acknowledged that their focus was mainly on demographic qualities of the Muslim population. The researchers of the previous study did not look at attitudes and perceptions within the Muslim community nor did it closely examine the needs and assets of these communities. Our present study is therefore the first of its kind. We aim to conduct regular updates to this study over the years to provide stronger data and analysis.
RESULTS: DEMOGRAPHICS
The 74-question survey with nearly 1,800 respondents resulted in a large volume of data. Tables 1 and 2 below summarize who responded to the survey, including the demographics of the respondent sample. The actual question responses are summarized in the subsections that follow: Demographics “Young and Diverse,” questions pertaining to the individual respondent (Individual), questions about the respondent family (Family), questions pertaining to the Muslim community (Community), and questions regarding perspectives beyond the Muslim community (Broader Society).
Demographics: Young and Diverse
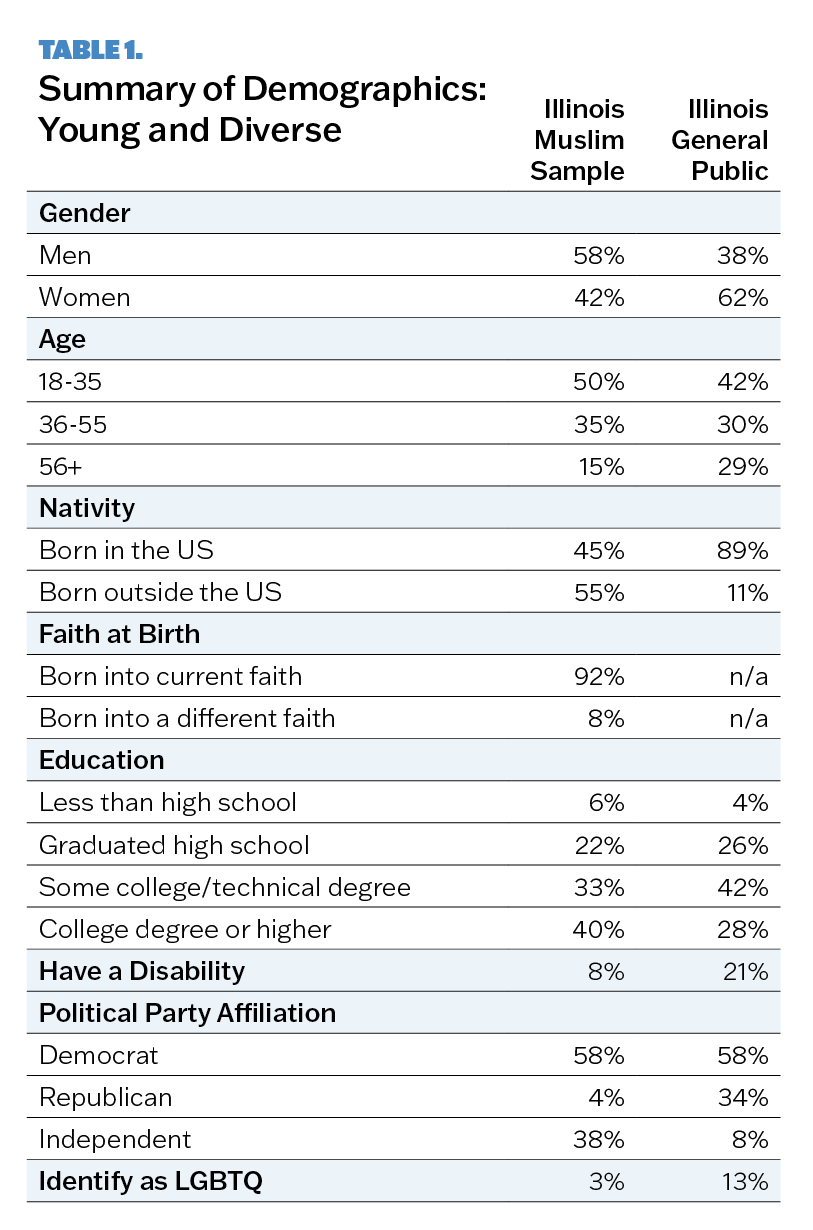
Respondents were relatively young and diverse across a broad range of demographic and socioeconomic factors. Over half (58%) of the Muslim sample was comprised of men while 38% of the Illinois general public sample was comprised of men. It is typically found that women respond to surveys more than men, so the slight overrepresentation of men in this sample is an interesting deviation from the norm.
The Illinois Muslim sample was on average younger than the state’s general public, with 50% of the Muslim sample between 18 and 35, compared to 42% of the general public. The general public is also roughly twice as likely as the Muslim sample to be over the age of 56 (29% vs. 15%).
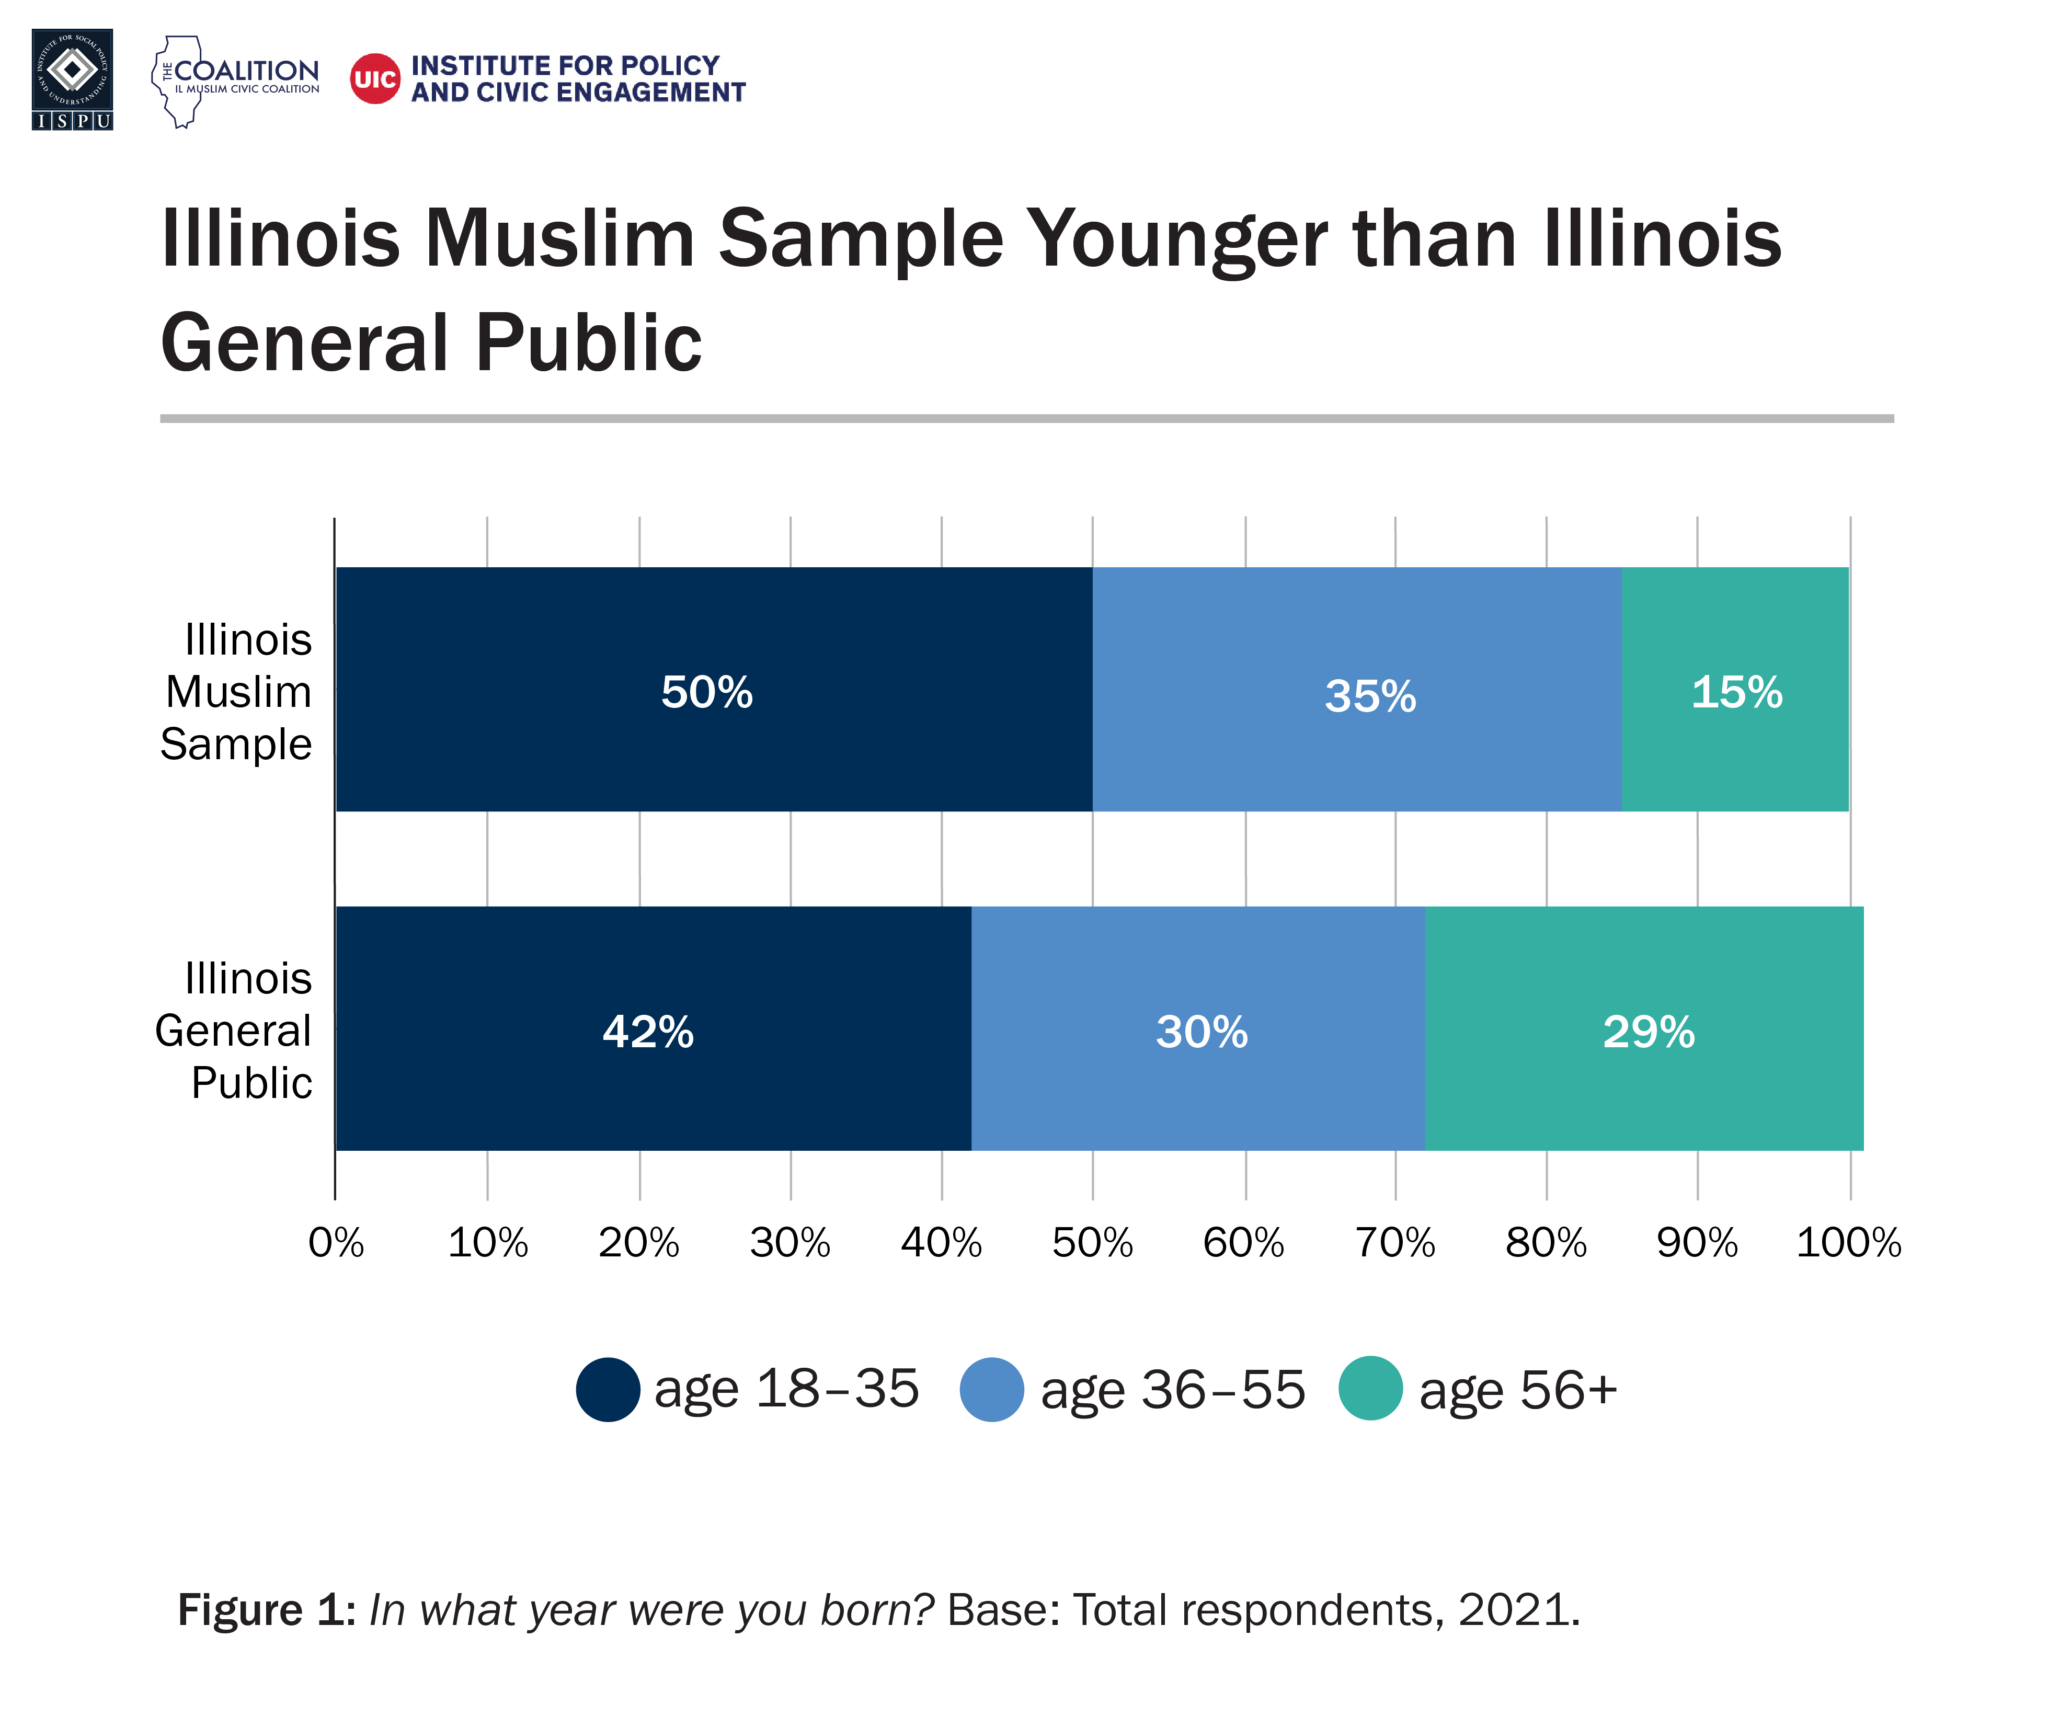
A bar graph with two bars depicting the age distribution of the Illinois Muslim sample and the Illinois general public
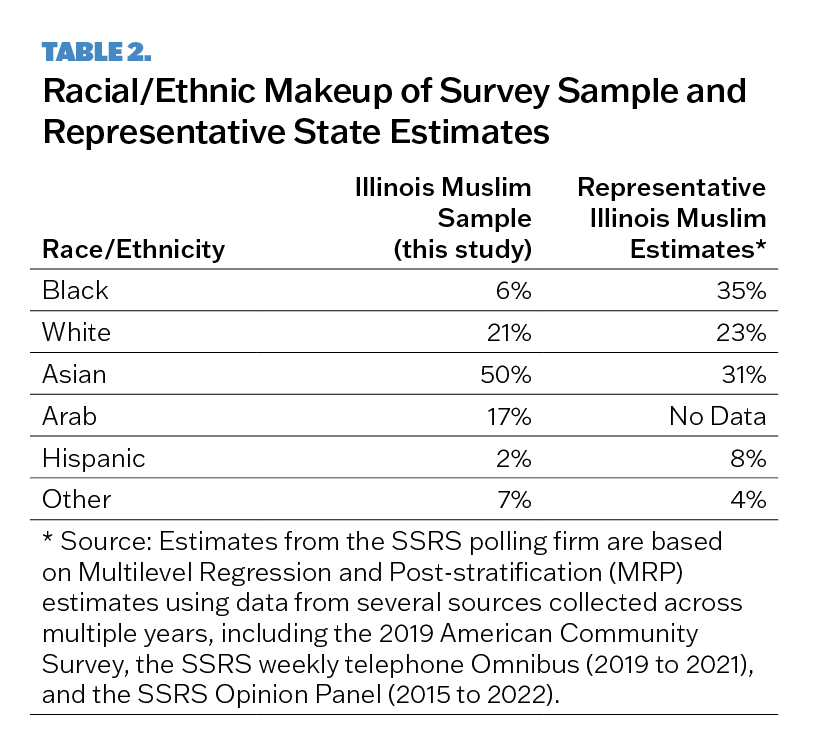
In terms of racial breakdown, the Muslim sample consisted of 50% Asian Muslim, 21% white Muslim, 17% Arab Muslim, 6% African American Muslim, and 1% American Indian/Alaska Native Muslim. Latinos accounted for 2% of the Muslim sample. As previously noted, this is an underrepresentation of African Americans and an overrepresentation of Asian Americans. Estimates from SSRS [6], a nationally recognized polling firm, reveals the following racial/ethnic makeup of Illinois Muslims: 23% non-Hispanic white, 35% non-Hispanic Black, 8% Hispanic, 31% Asian, and 4% non-Hispanic other. It is important to note that these estimates did not include “Arab” as a racial/ethnic category, which is available in ISPU’s national representative American Muslim Poll. According to these representative national surveys, the racial representation of American Muslims is 28% African American or Black and 19% Asian.

A pie chart showing the racial/ethnic diversity of the Illinois Muslim community based on representative polling data
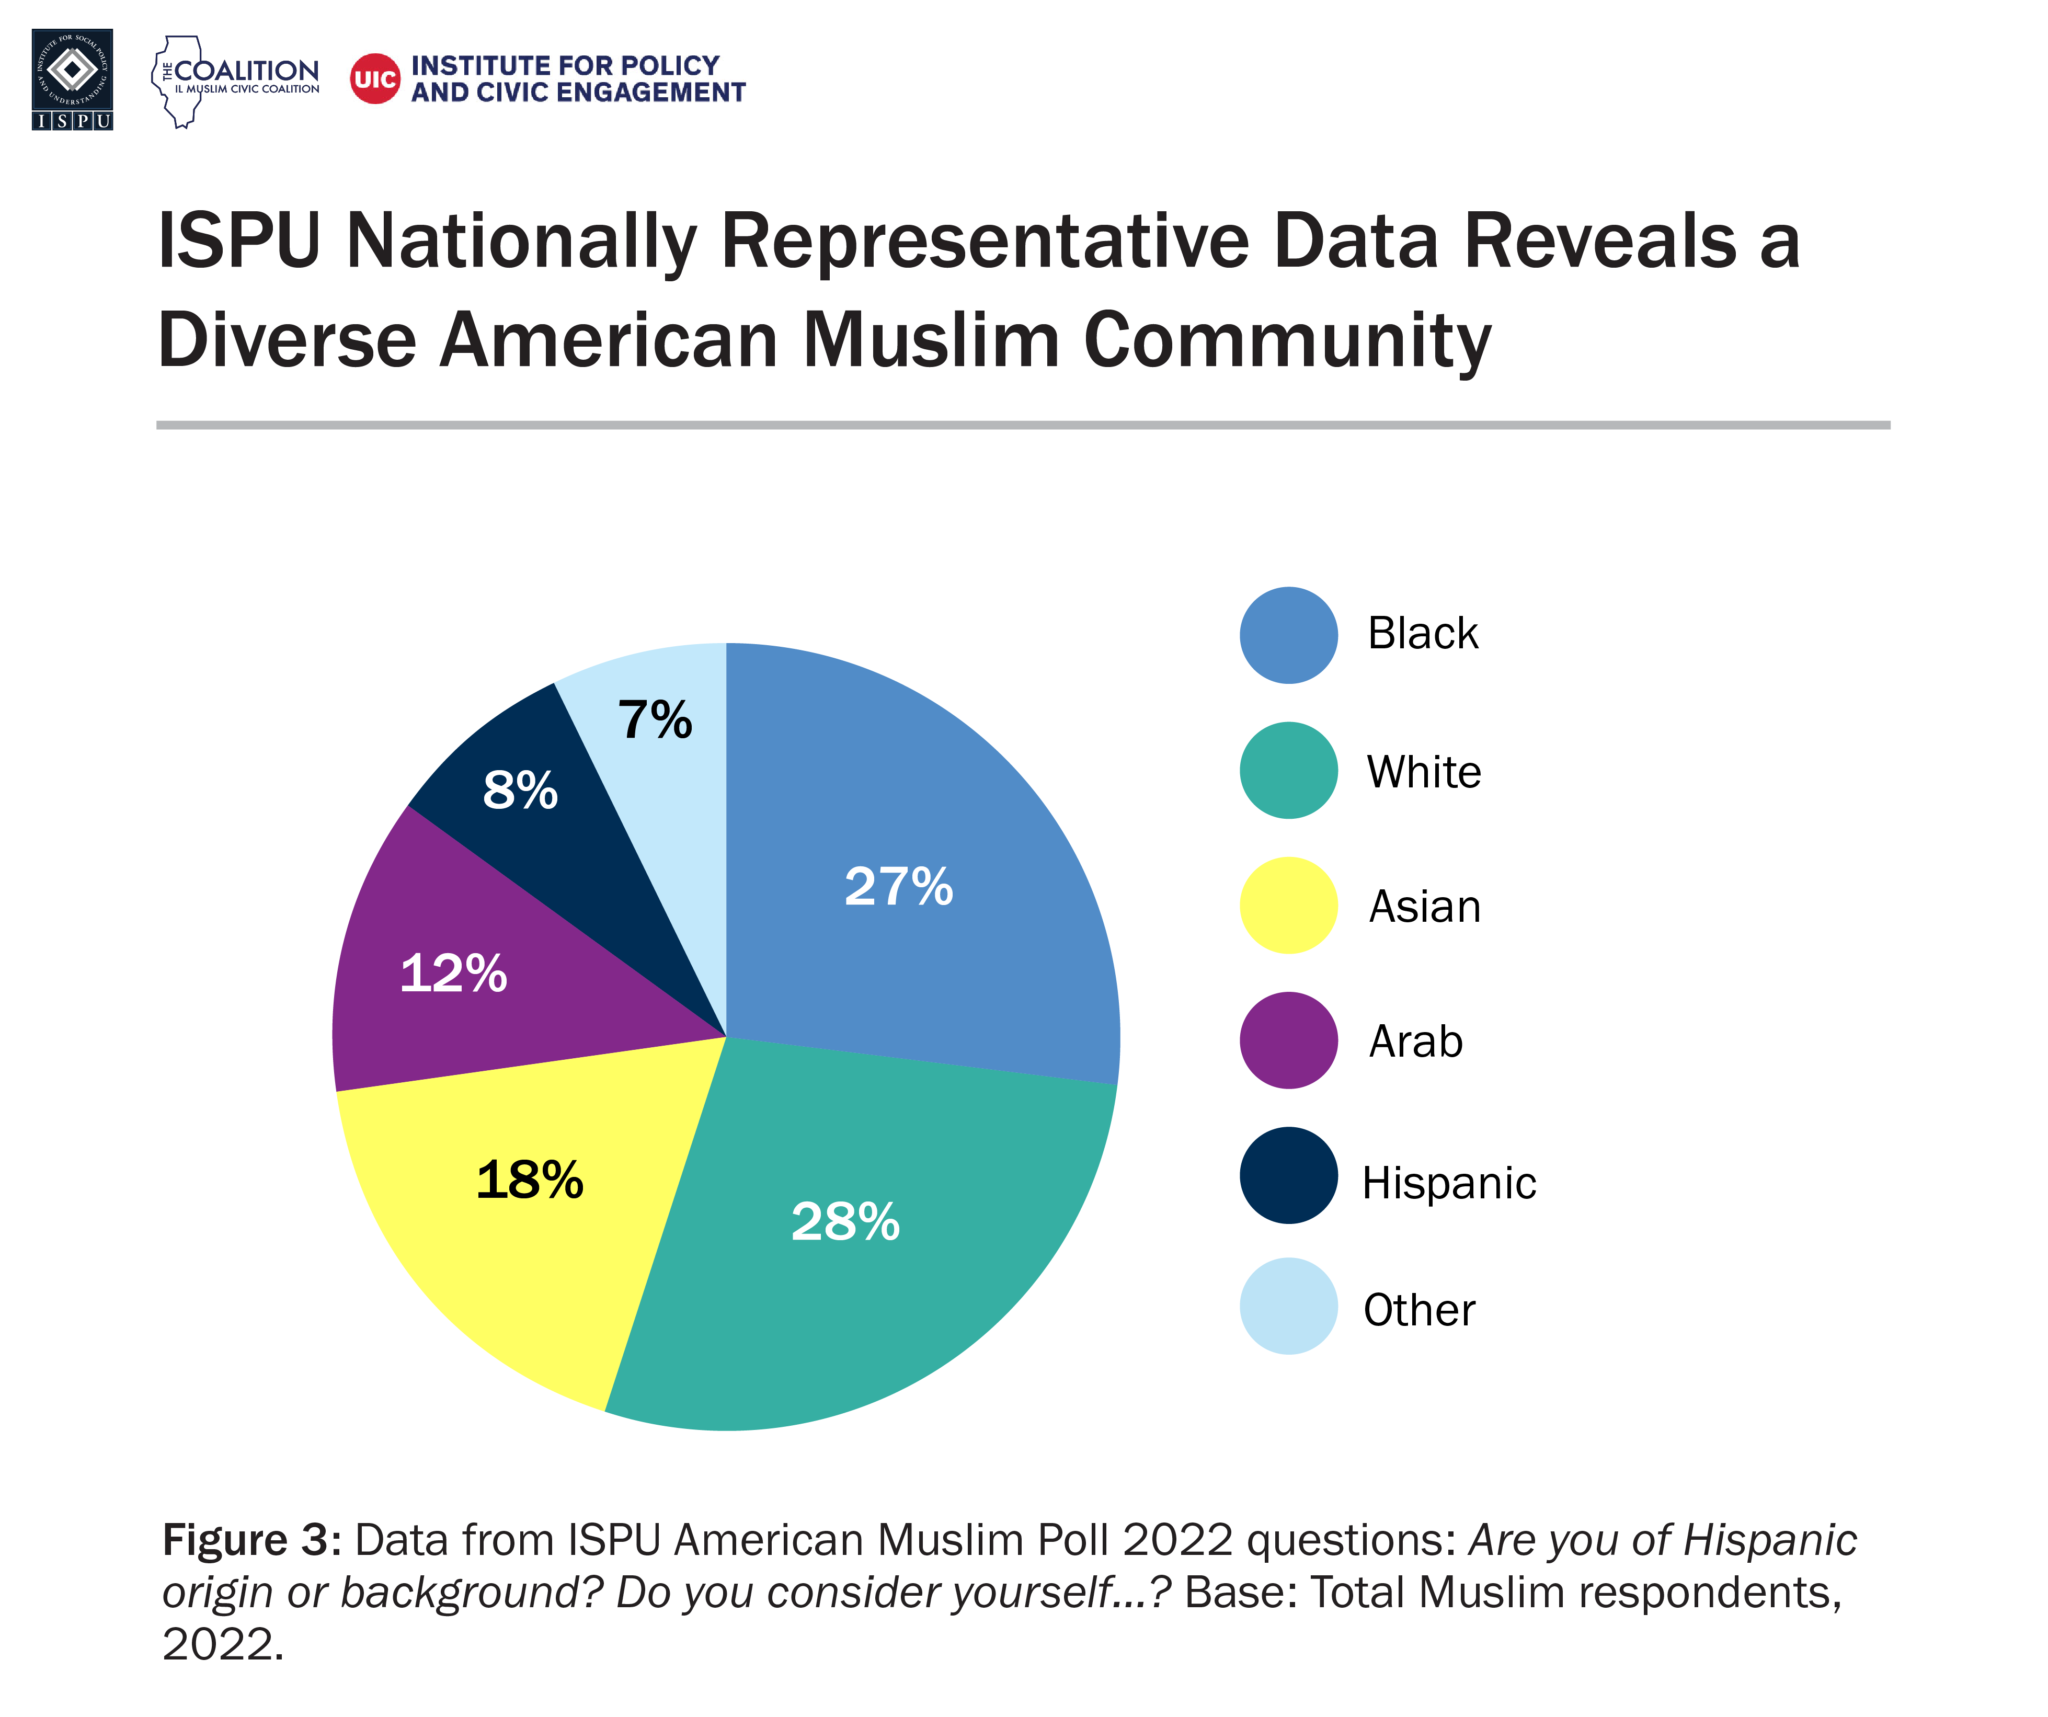
A pie chart showing the racial/ethnic diversity of the national American Muslim community based on ISPU’s nationally representative American Muslim Poll
Sixty-three percent of respondents in the Illinois Muslim sample spoke English at home. Fifteen percent of respondents stated that in addition to English, they spoke Arabic, while 9% responded that they speak Bosnian at home in addition to English. Four percent of the respondents stated they speak another language that wasn’t listed in our options, and 2% stated they speak Turkish at home in addition to English.
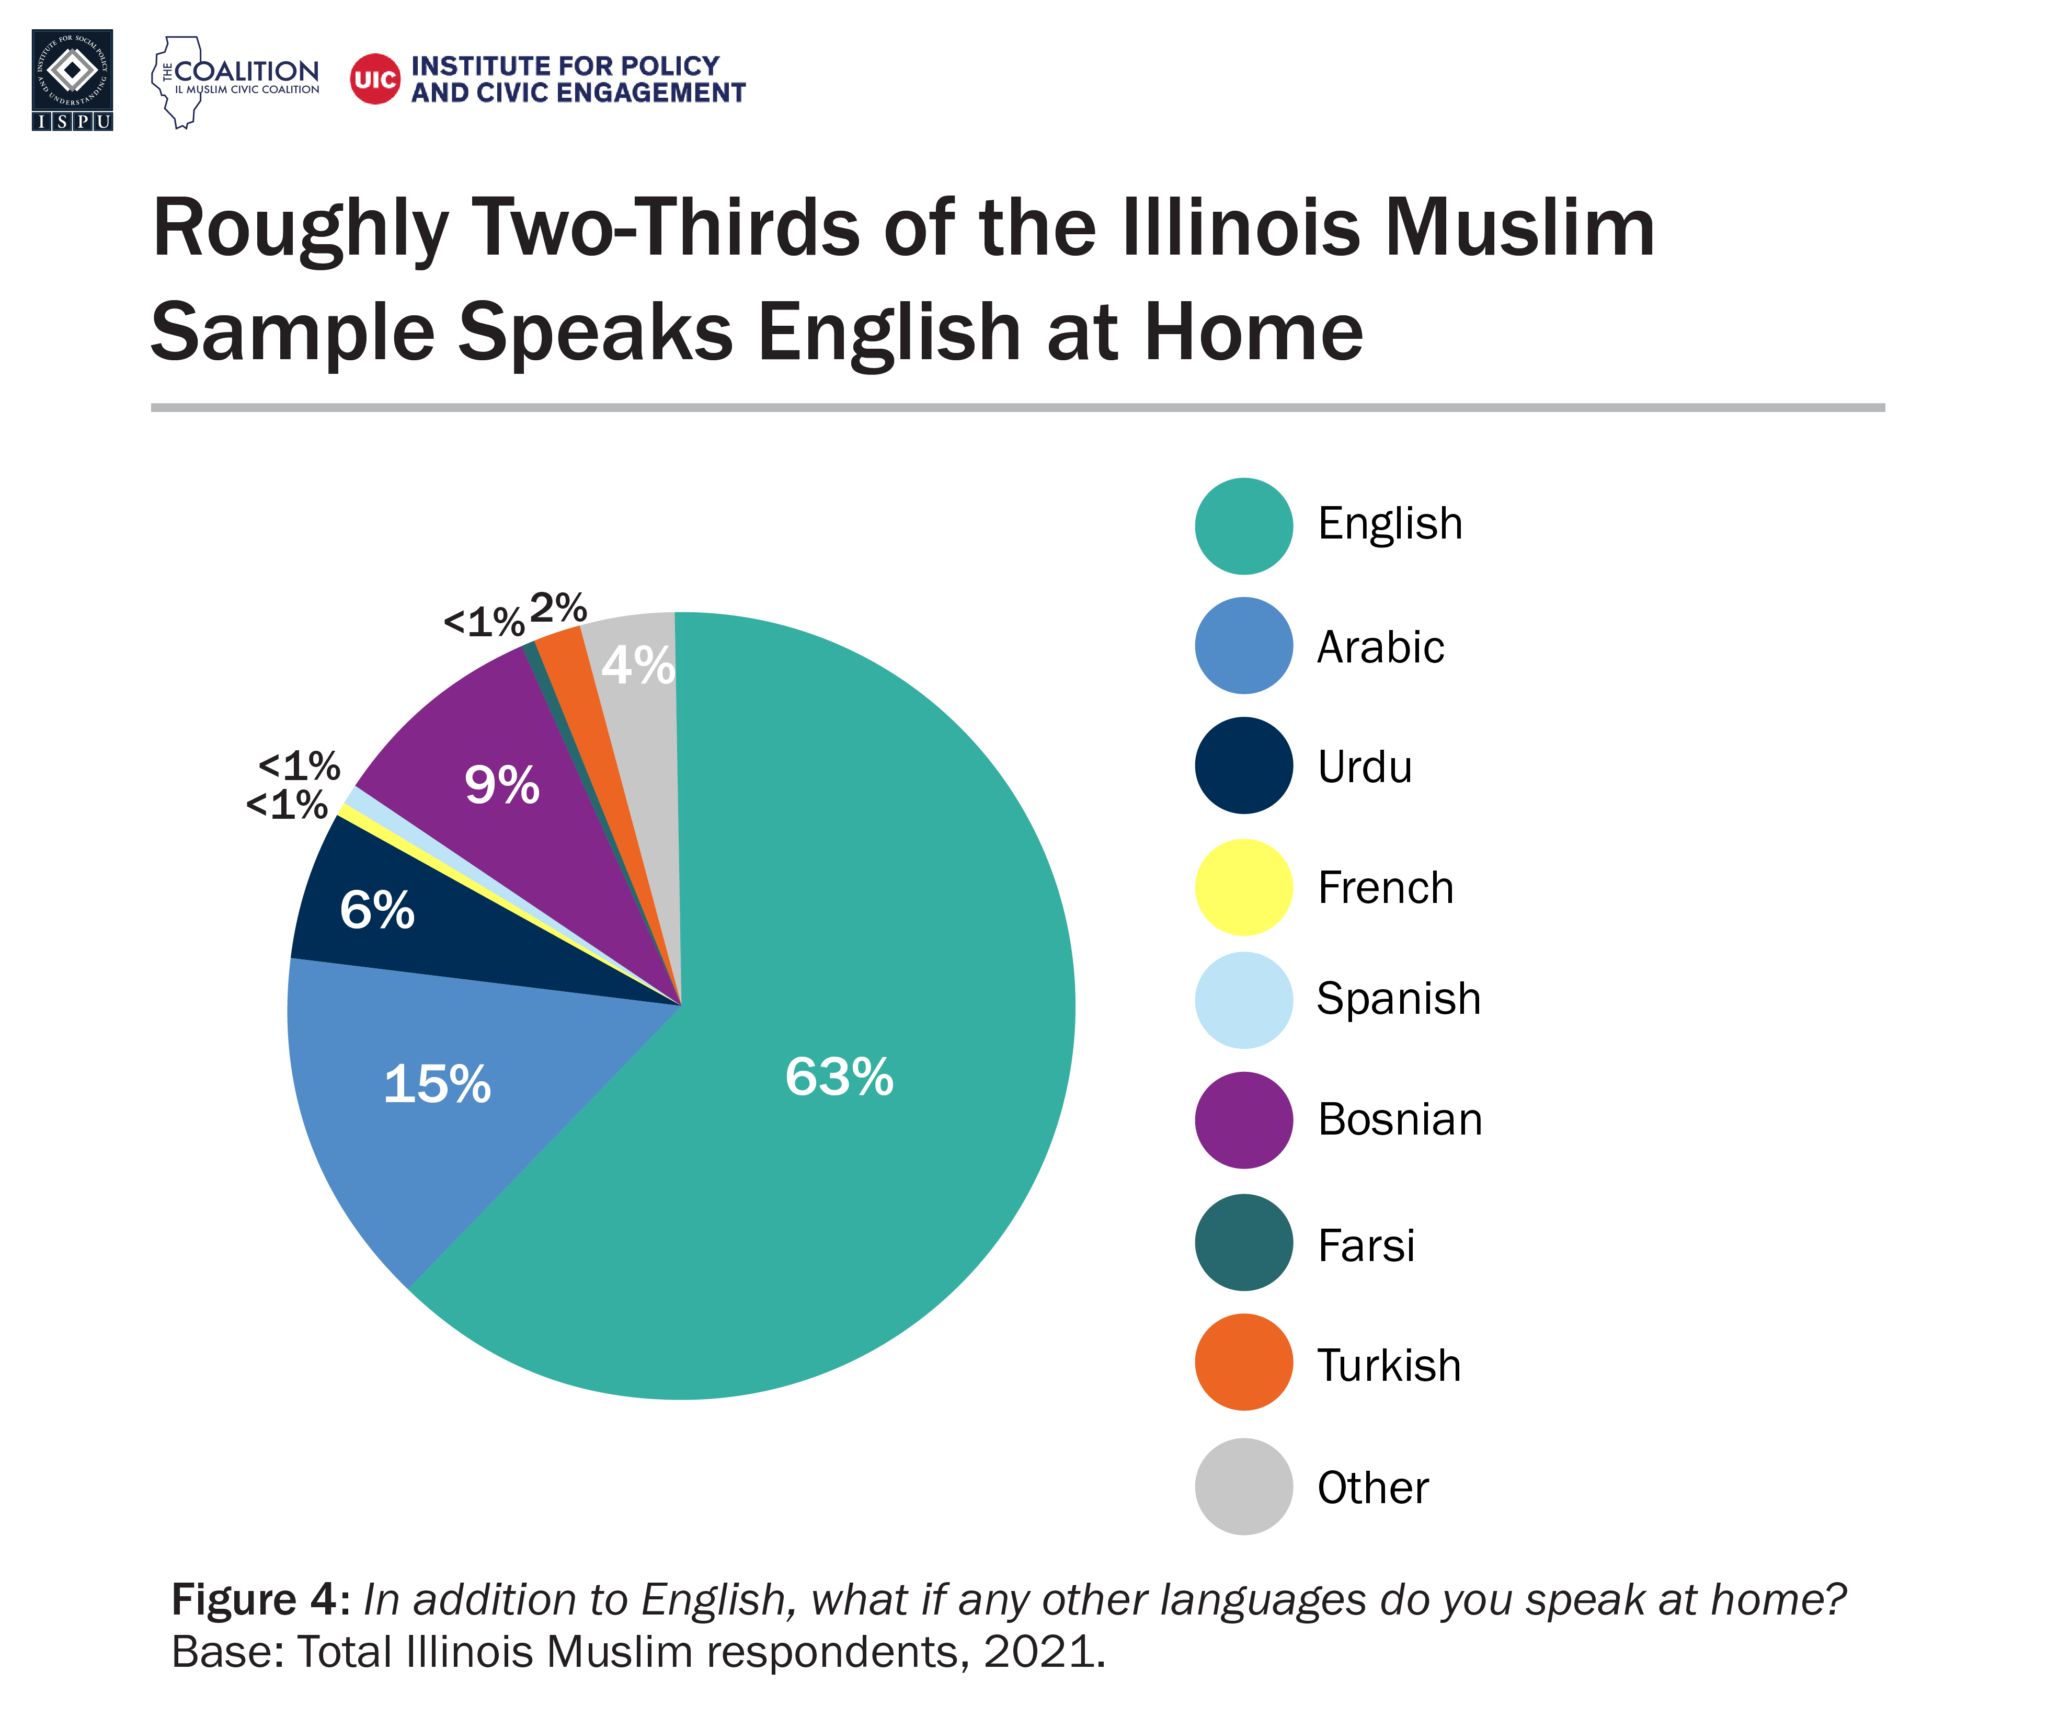
A pie chart showing languages spoken at home among the Illinois Muslim sample
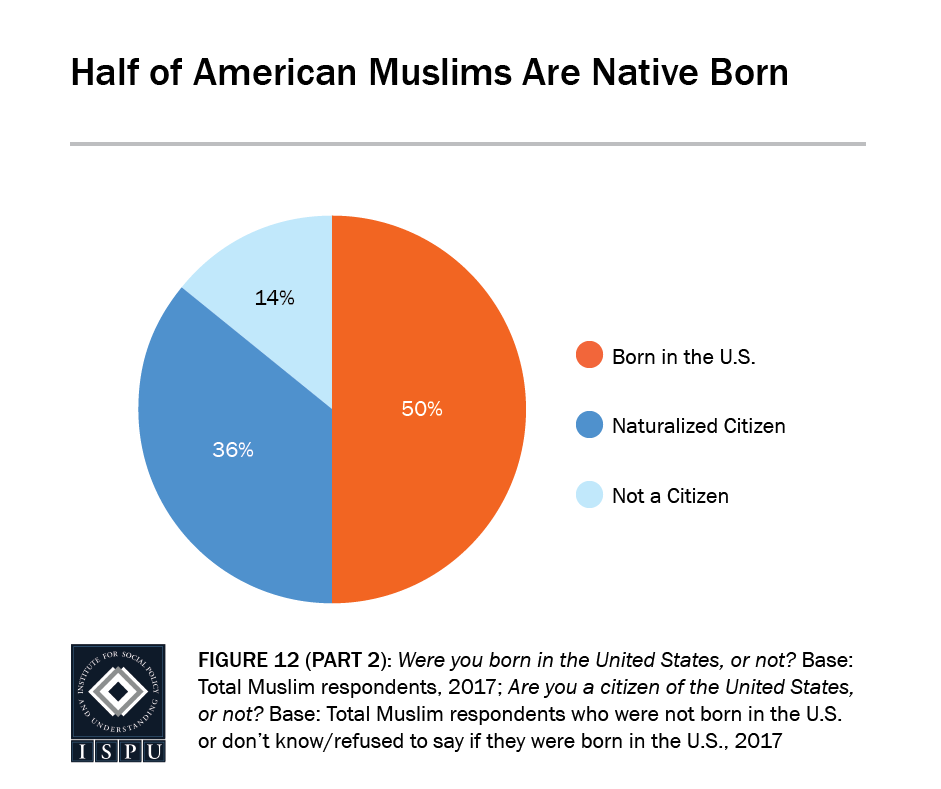
More than 50% of the Muslim sample was born in the United States, as opposed to 89% of the Illinois general public sample. That said, 92% of our Muslim sample is eligible to vote. This result mirrors ISPU’s national survey of Americans who are Muslim, where roughly half are native born and half are immigrants. In our Illinois Muslim sample, of those born in a different country, 50% were born in South Asia, 20% were born in the Middle East, 20% were born in Europe, 2% were born in Southeast Asia, and 7% were born in Africa. Despite self-identified Asians making up 50% of survey members born outside the United States, only 6% of all individuals spoke Urdu at home in addition to English.

A pie chart showing the proportion of the Illinois Muslim sample born in the United States vs. outside of the United States
In the Muslim sample, 92% of the respondents stated they were raised Muslim. Additionally, 1% were raised Protestant, 1% were raised agnostic, 2% were raised Roman Catholic, and 4% were raised in some other religion. Of the individuals who identify as Muslim, 69% identify as Sunni Muslim, 2% identify as Shiite Muslim, and 1% identify as either Sufi or Salafi. Fewer than 1% identify as either Ahmedi, Ismaili, or a member of the Nation of Islam. It is important to note that 26% of individuals referred to themselves as just Muslim, foregoing sub-religious identification.

A pie chart showing the percent of Illinois Muslims sample that was raised Muslim versus raised in some other faith or non-faith
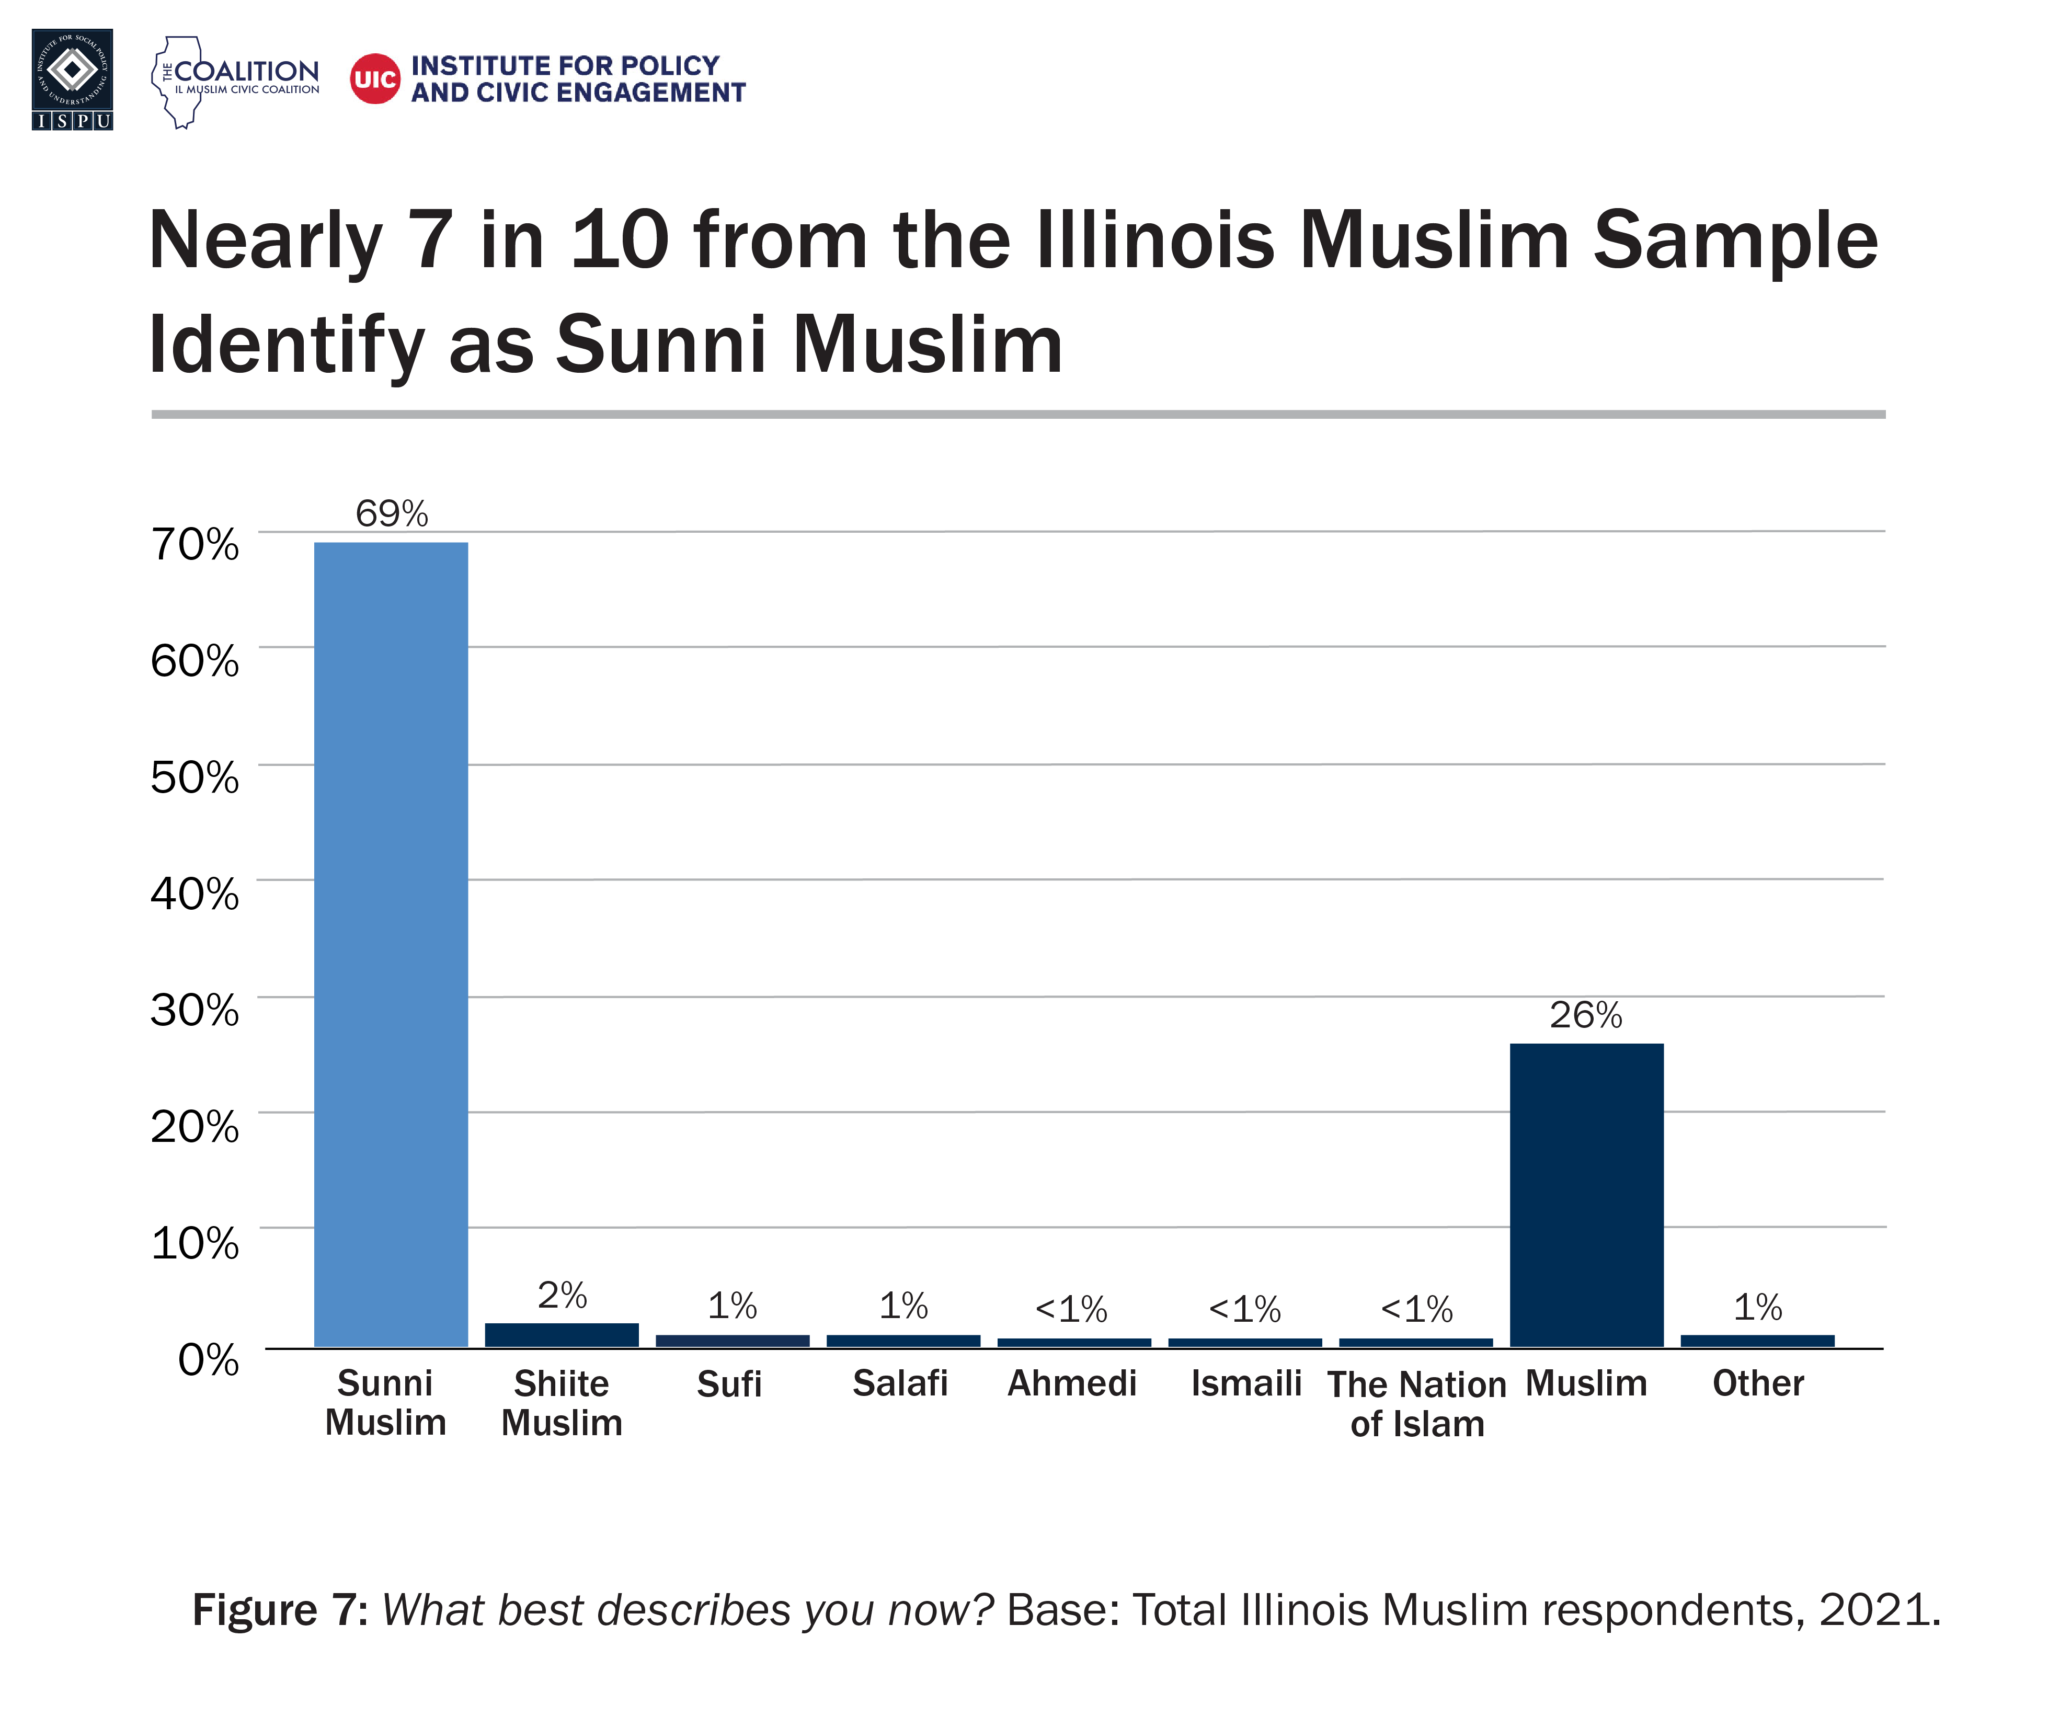
A bar graph showing how the Illinois Muslim sample identifies in terms of religious/sect identity
In terms of education, 40% of respondents in the Muslim sample have a college degree or higher, compared with 28% of the Illinois general public sample. One-third (33%) of the Muslim sample and 42% of the Illinois general public have completed some college or a technical degree. Similar proportions of the Muslim sample and general public have graduated high school (22% and 26%, respectively). Among the Muslim sample, 6% had less than a high school education while 4% of the Illinois general public sample had less than a high school education.
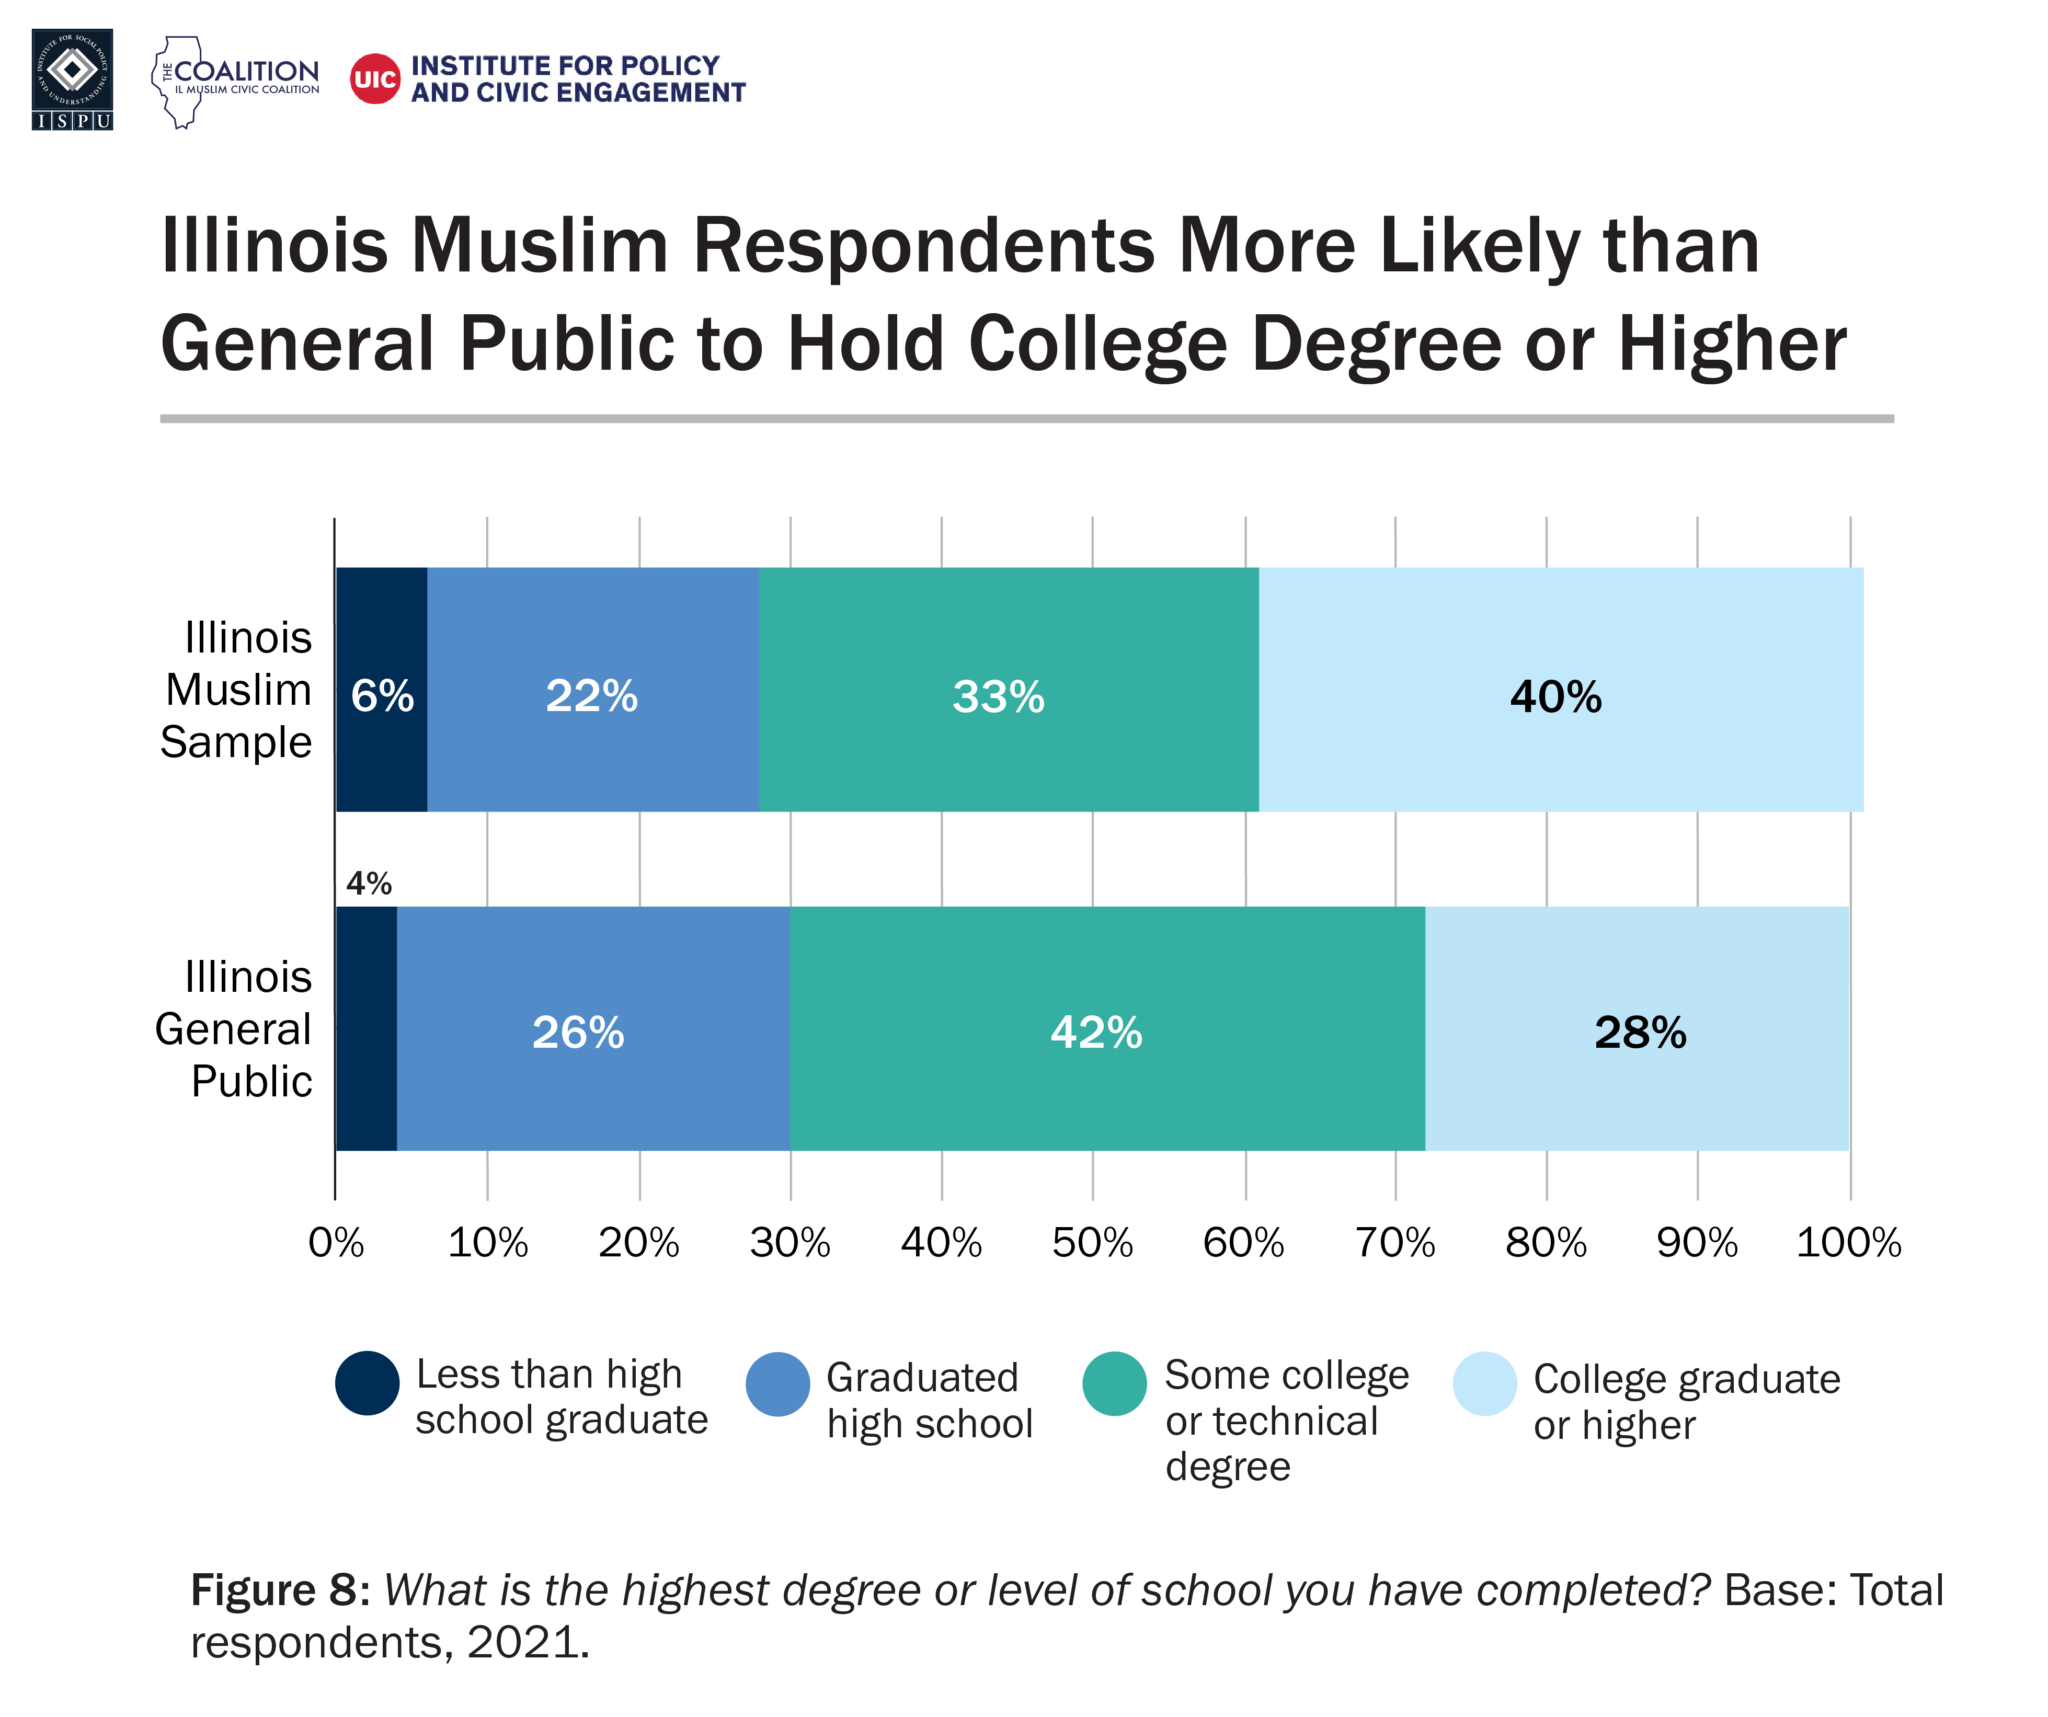
A bar graph with two bars showing educational attainment among the Illinois Muslim sample and Illinois general public
Eight percent of respondents in the Muslim sample stated they have a disability. Nationally, one in three Muslims reports they or an immediate family member have a disability. Community leaders cannot afford to ignore the needs of this segment of any community and should start by listening to the impacted members to learn how faith spaces can better meet their needs.
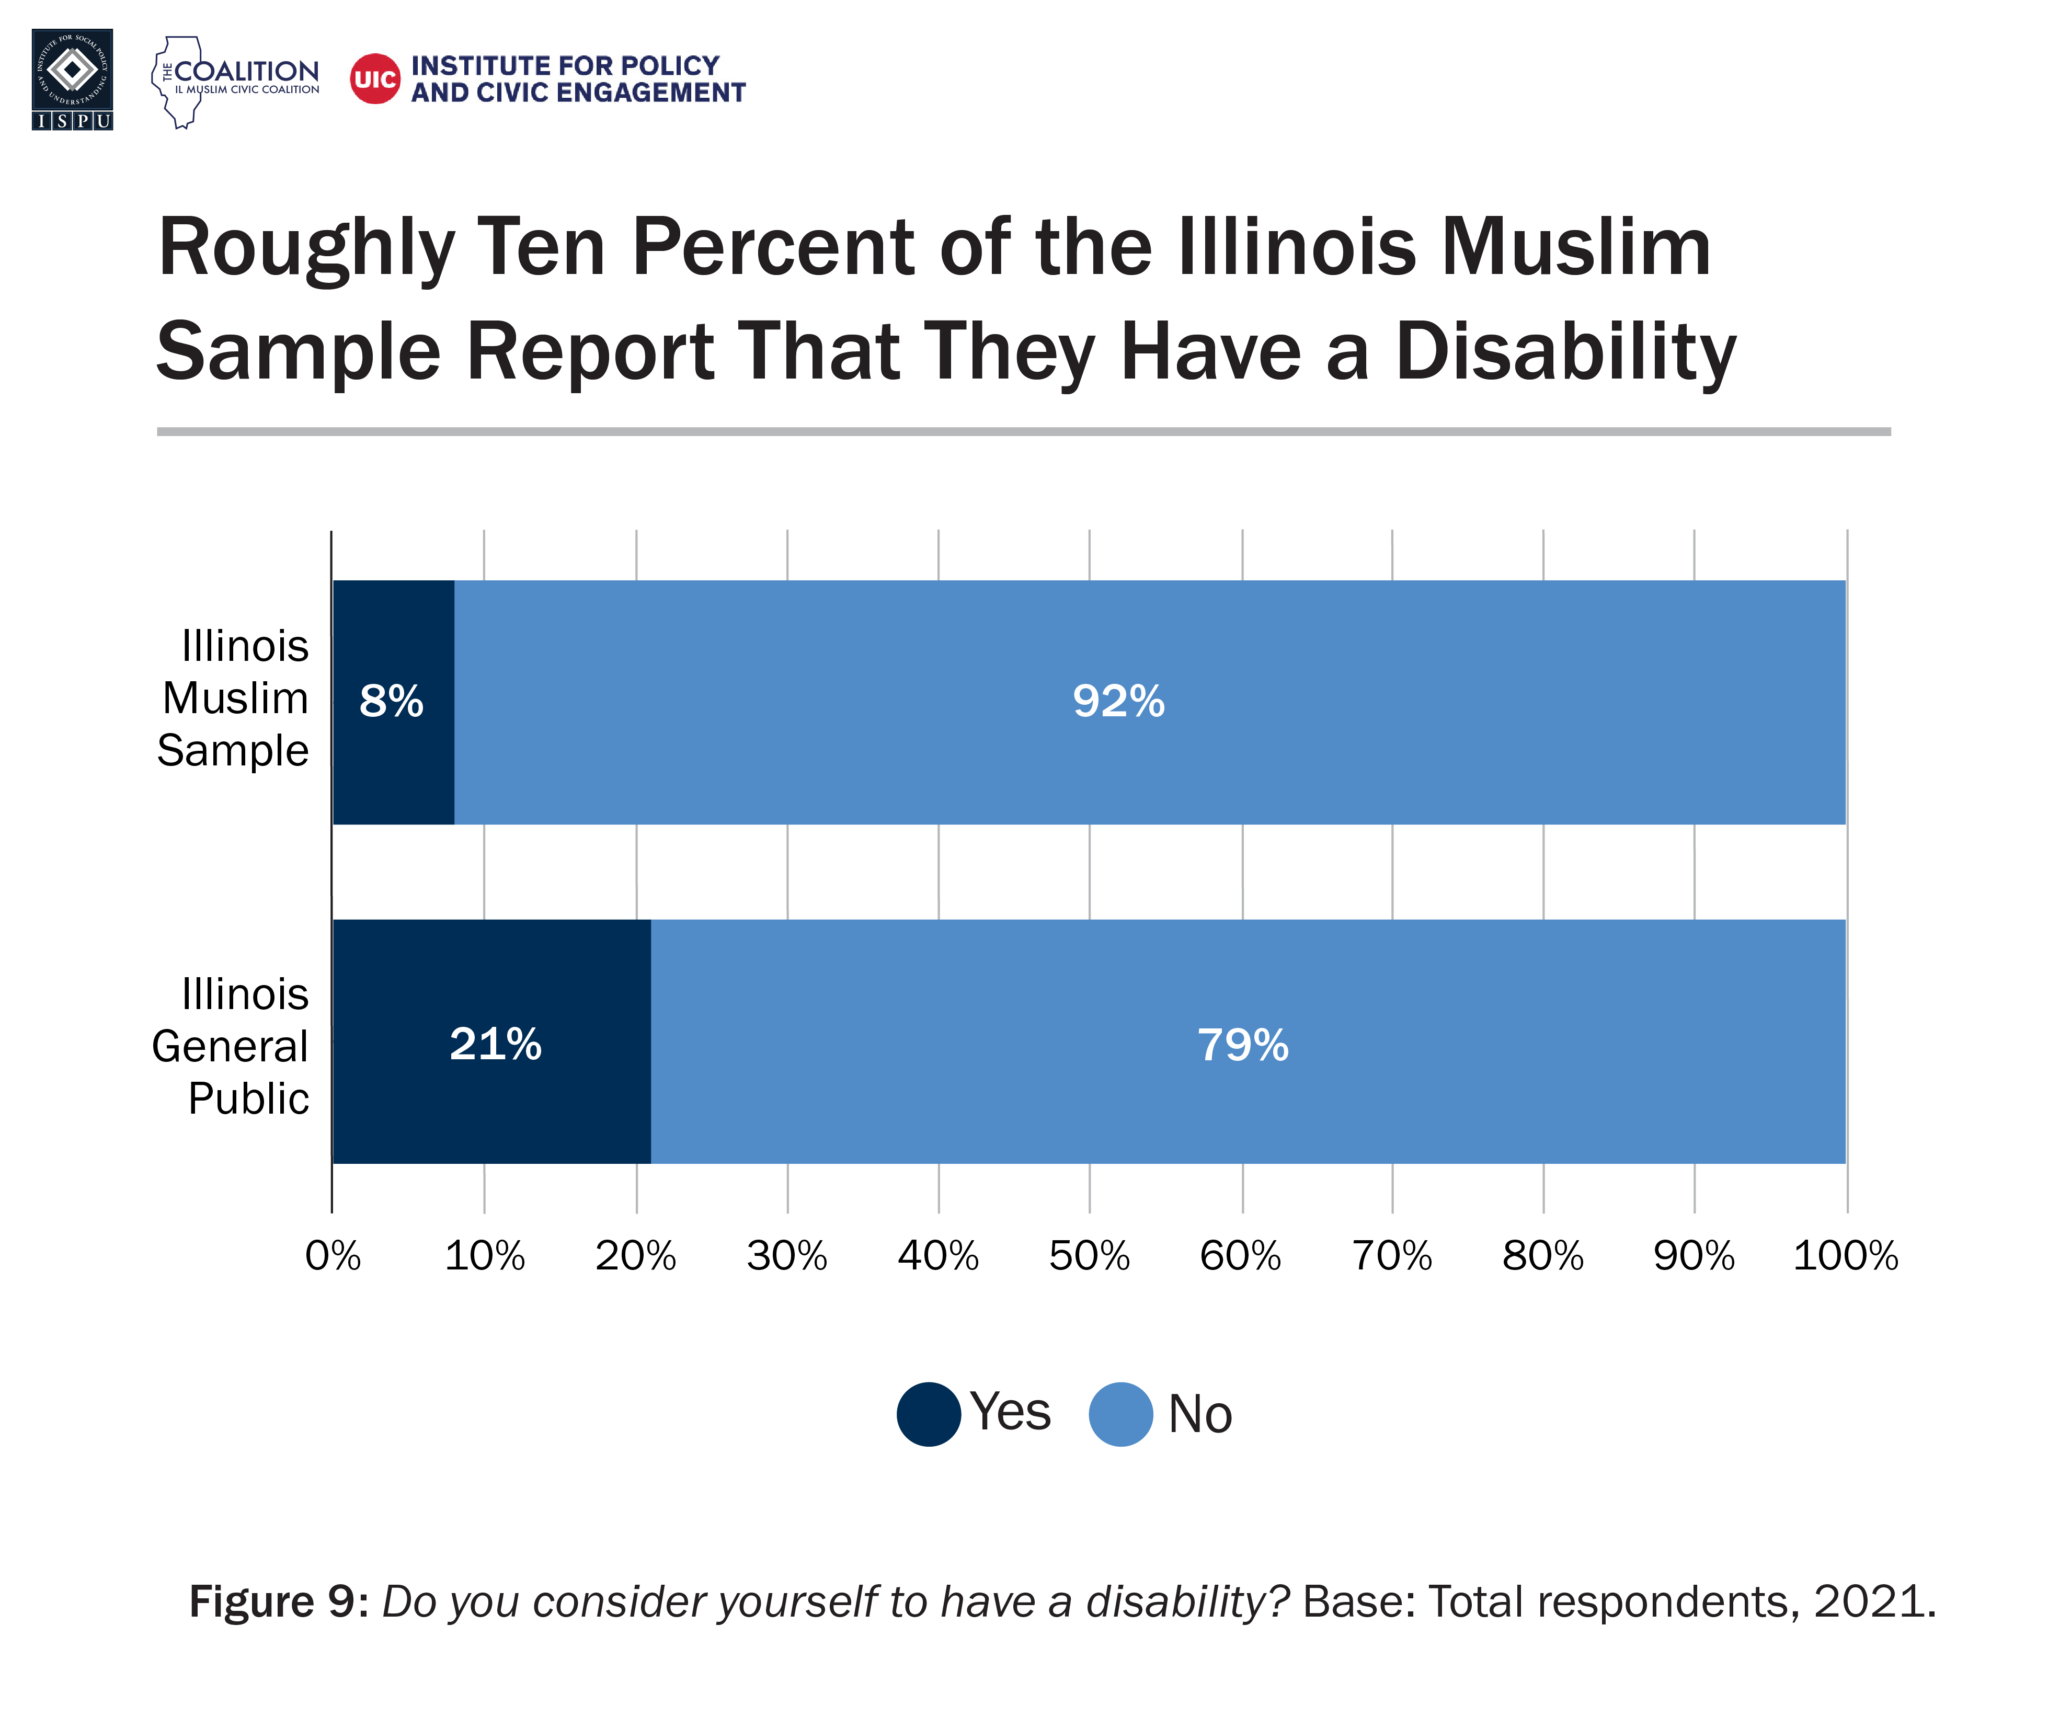
A bar graph showing the proportion of the Illinois Muslim sample and Illinois general public who report having a disability
Politically, 58% of the Muslim sample and the Illinois general public identify as Democratic, and 38% identify as independent, more likely than the general public in the state where only 8% claim this political description. As a community with a significant percentage identifying as “Independent,” Muslims in Illinois may be less tied to partisanship and more to principles when making political choices. It also opens opportunities for both parties to win over segments of the community. Among the Muslim sample, 4% identify as Republicans less likely than the Illinois general public (34%).

A bar graph with two bars showing political party identification among the Illinois Muslim sample and Illinois general public
Among the Muslim sample, 3% of the Muslim sample identified as LGBTQ, compared to 13% of the Illinois general public sample.
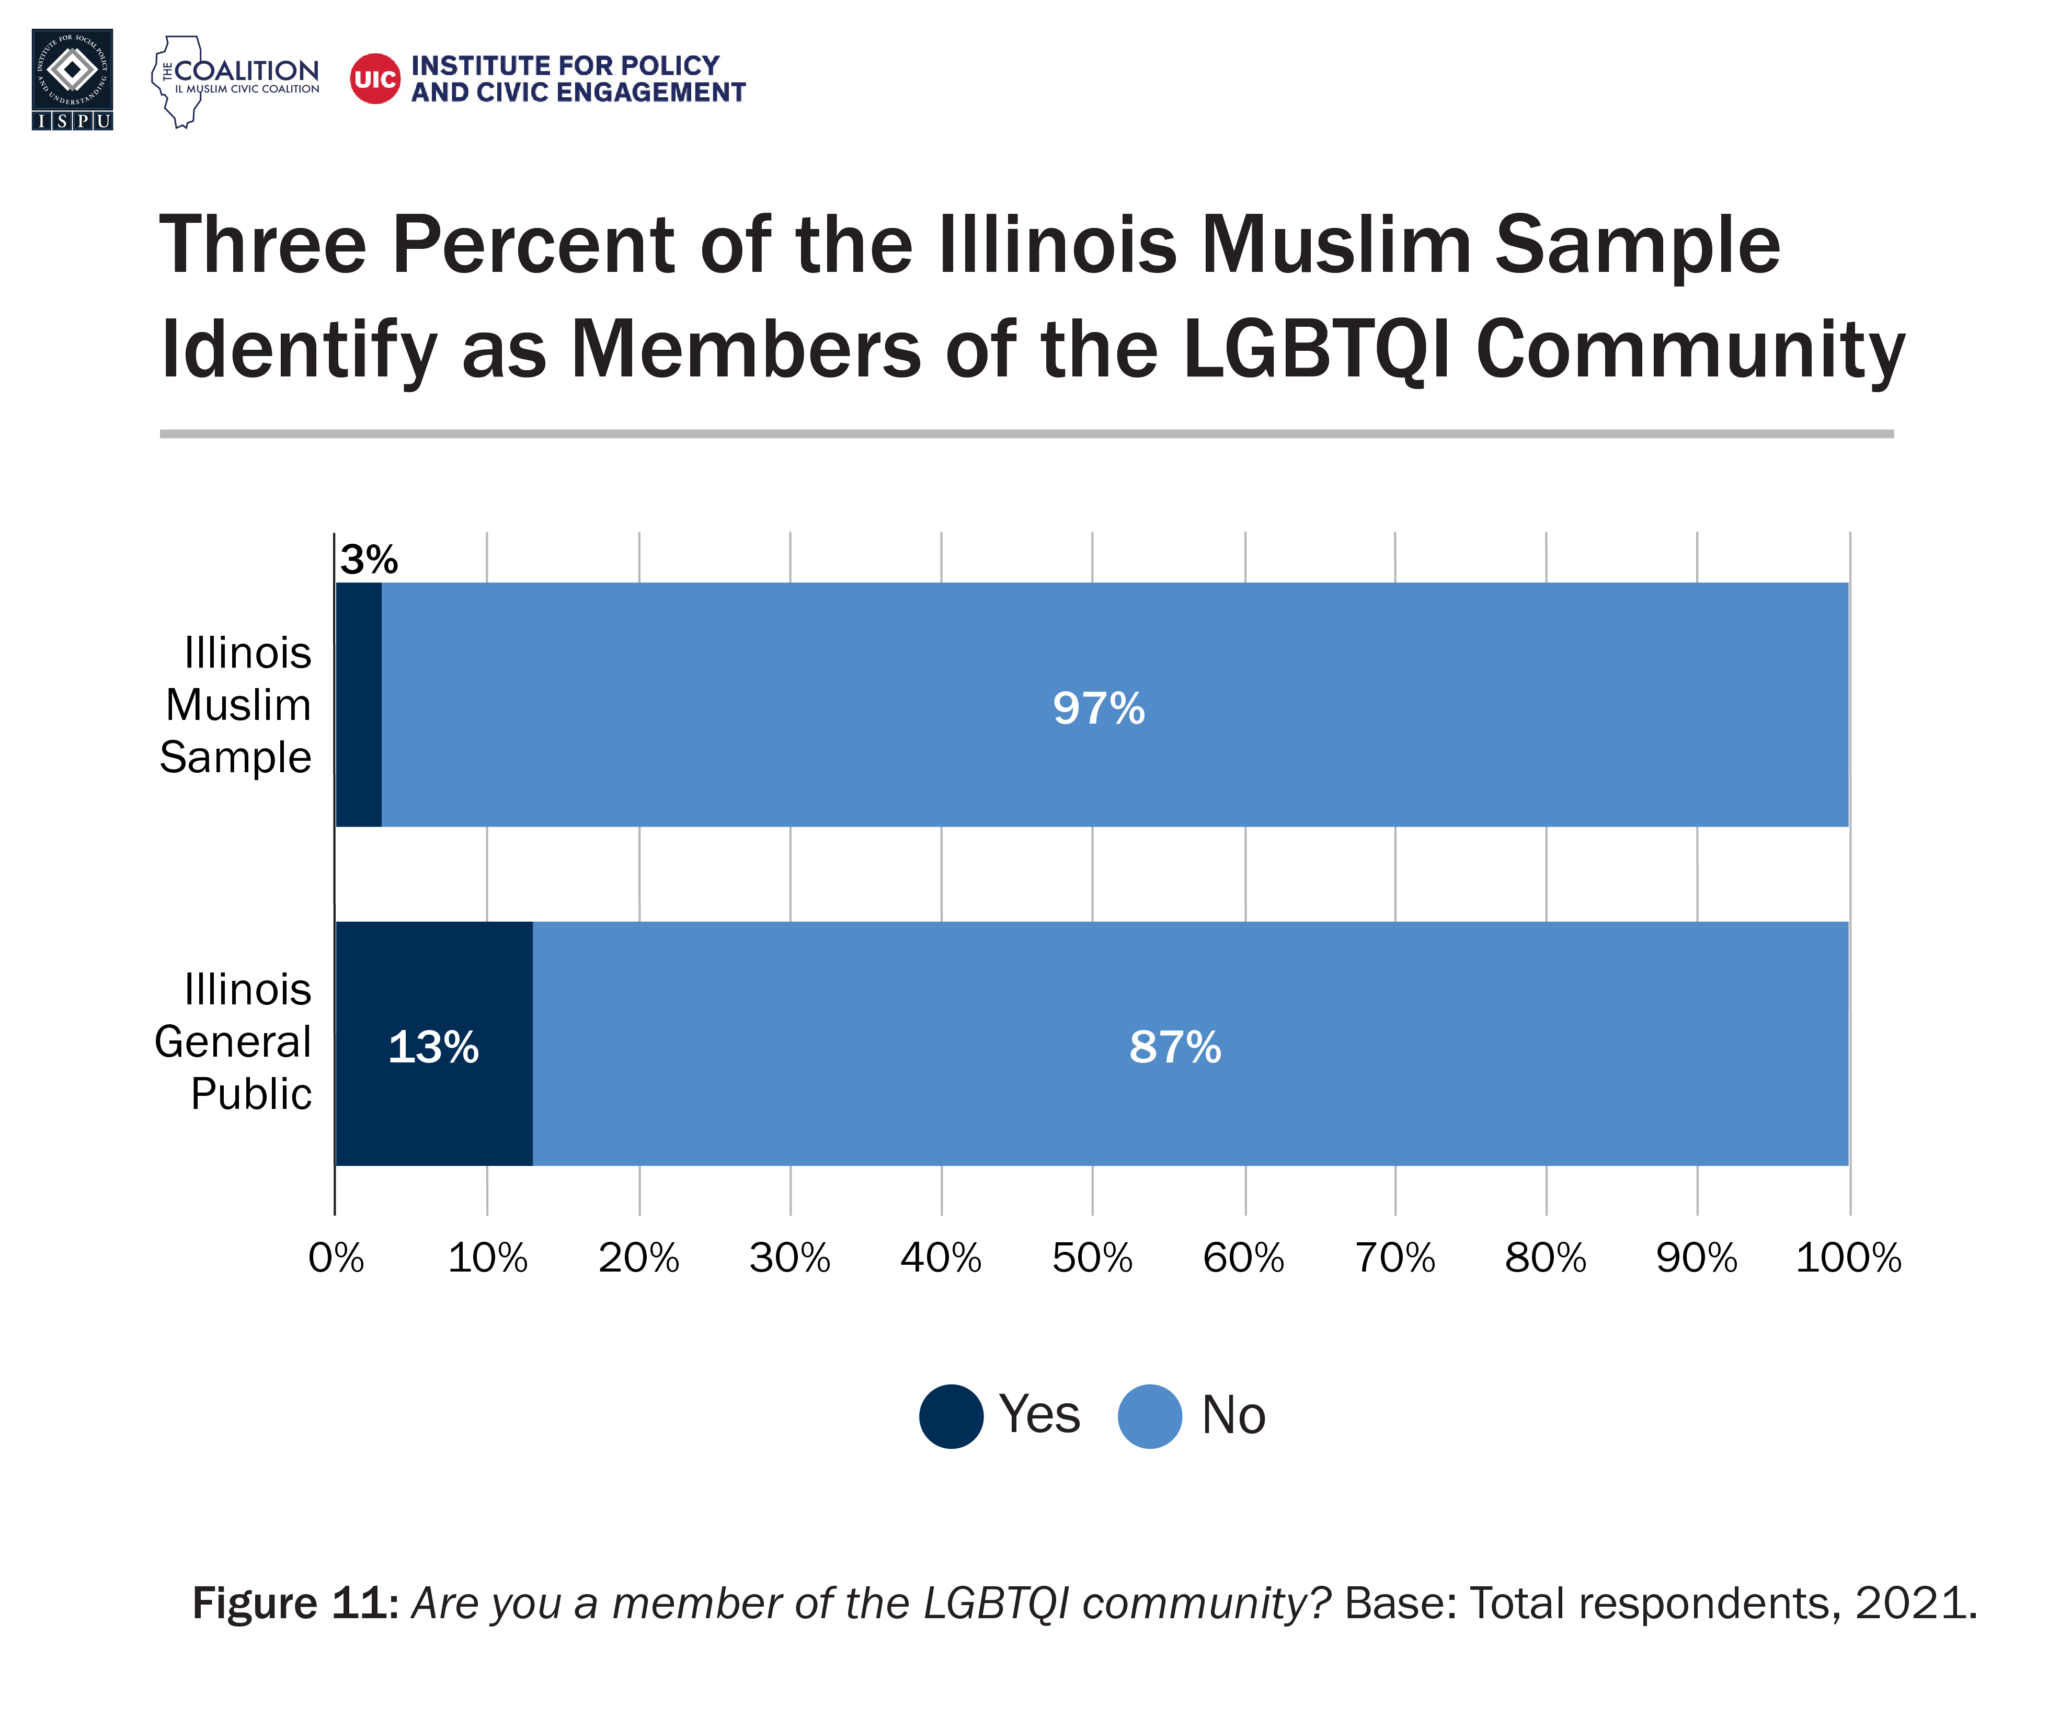
A bar graph with two bars showing the proportion of the Illinois Muslim sample and Illinois general public who identify as members of the LGBTQI community
In total, respondents in the Illinois Muslims sample reside in 22 counties in Illinois. Most of our participants (roughly 50%) came from Cook County, which consists of Chicago and the surrounding areas of Evanston, Schaumburg, Orland Park, and Tinley Park. Twenty-eight percent of respondents came from DuPage County, which comprises the suburbs of Naperville, Oak Brook, and Downers Grove. Eight percent came from Will County and 4% of respondents came from Lake County, which consists of North Chicago and Waukegan.

A histogram showing the top 10 counties represented in the Illinois Muslim sample
NOTES
[5] https://worldpopulationreview.com/state-rankings/muslim-population-by-state
[6] Estimates from the SSRS polling firm are based on Multilevel Regression and Poststratification (MRP) estimates using data from several sources collected across multiple years, including the 2019 American Community Survey, the SSRS weekly telephone Omnibus (2019 to 2021), and the SSRS Opinion Panel (2015 to 2022).
